Energy
A data visualisation and reporting solution designed to transform complex information into clear, accessible and engaging digital content for different stakeholder audiences.
Data Visualisation & Reporting
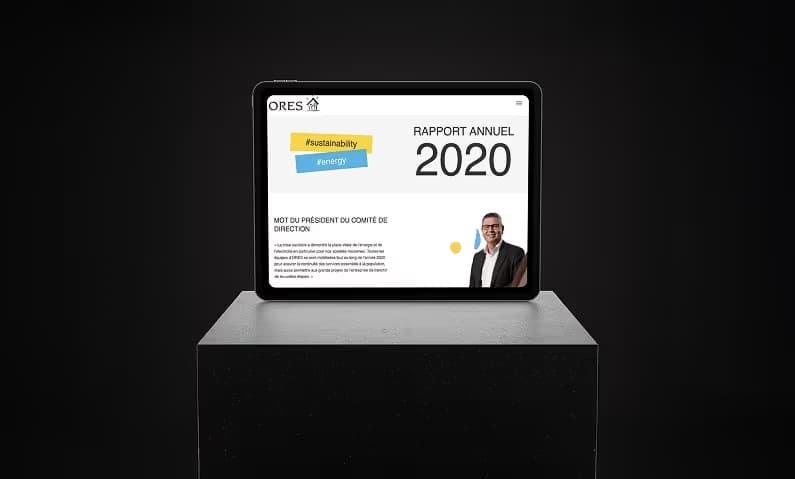


Representing complex themes of mobilization, energy, ecology, and sustainability in a clear, engaging report
Applied a multi-layered methodology to structure content and visuals, ensuring clarity while preserving thematic depth
Coordinating multiple teams and contributors while maintaining high-quality output
Established efficient workflows, regular checkpoints, and collaborative review processes to ensure smooth cooperation
Communicating technical sustainability data in a visually compelling and accessible format
Designed infographics, charts, and layouts that simplify complex data while maintaining accuracy and impact
Creating a report that engages stakeholders and reflects the company’s commitment to a greener future
Integrated storytelling, real-life examples, and sustainability highlights to inspire and inform readers effectively
Result
The result is a structured reporting experience that makes complex information easier to understand and communicate. Clear information design and visualisation provide a flexible foundation for presenting data consistently across different audiences.
Next project



Say Hullo!
Book a free 30-minute online session on the day that works for you.